Visualization
-
Identifying Semantic Model Capacity Spikes Using Workspace Monitoring
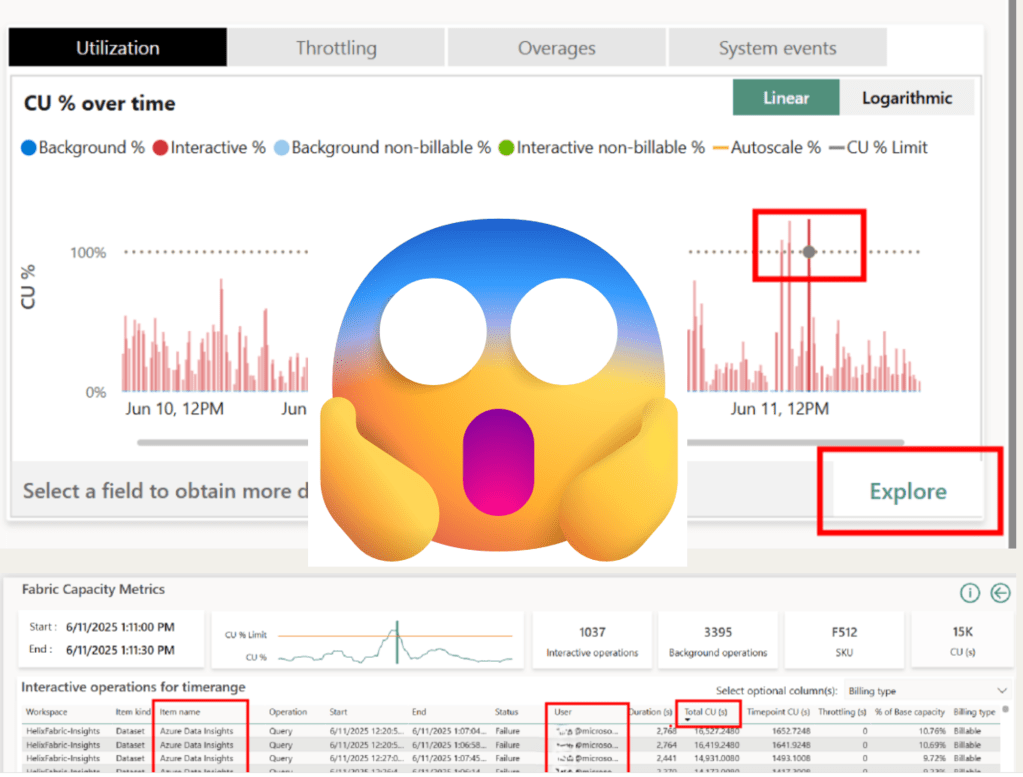
Introduction Part of my role is to monitor our team’s Fabric capacity utilization, and one of the main tools we use is the Capacity Metrics app. I’m sure this never happens to you 😉, but our semantic models sometimes cause our utilization to cross the 100% threshold. Unfortunately, getting the details you need to identify Continue reading
-
Fabric Toolbox: Semantic Model Audit
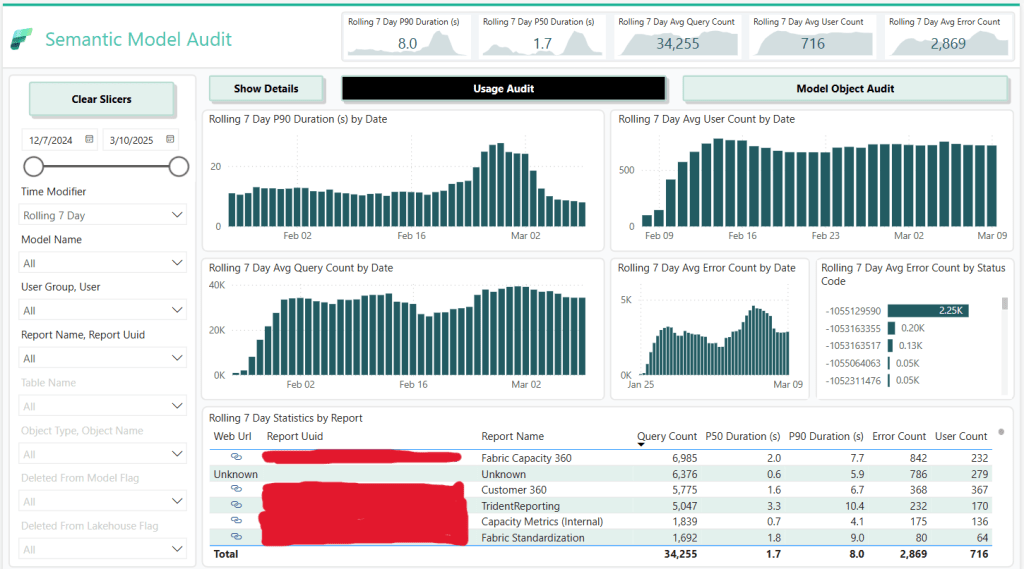
Introduction Another role of the Azure Data Insights & Analytics team is building and maintaining the internal analytics and reporting for Azure Data. My job is to develop, maintain and optimize the Semantic Models that support our reporting. In order to monitor and audit our models’ performance, we developed a tool called Semantic Model Audit, Continue reading
-
Reducing Semantic Model Size with Creative Solutions
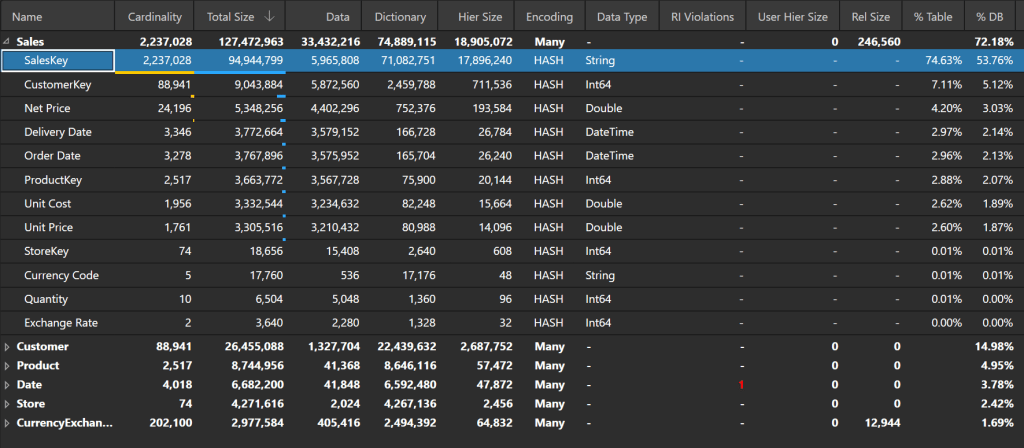
Introduction When working with larger semantic models, one of the things you are constantly trying to do is to reduce the model size while still meeting stakeholder requirements. Smaller models often result in faster queries, and you need to keep models under a certain size to stay within capacity memory limits. One common problem child Continue reading
-
Enhancing Your Golden Semantic Model with User Input Tables

Introduction While learning about Power BI, you are likely to learn that designing a star schema consisting of fact and dimension tables is critical to building a good semantic model. You will also learn that it is best practice to create “Golden” models that can be used to support multiple reports instead of creating a Continue reading
-
You Don’t Know Until You Test It: DAX Optimization

Introduction When working with DAX, there are many ways to get the same result, but performance can vary greatly. If you are anything like me, you want your code to be as performant as possible. Sometimes you have a good idea about what pattern is best and other times you don’t. There are even times Continue reading
-
Underrated Power BI Feature: Measures as Visual Filters
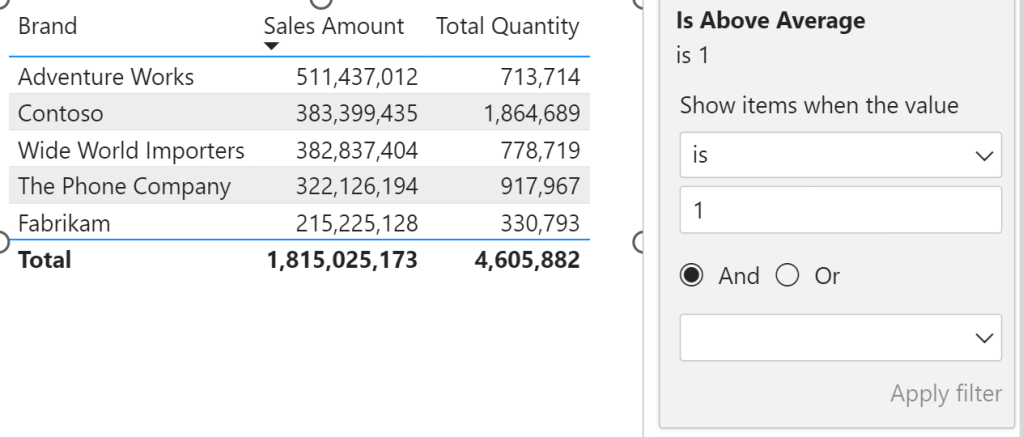
Introduction One of the features I love in Power BI that I don’t think gets enough love is the ability to use measures as filters on a visual. Unlike page or report filters, which have to be applied on columns in a table, visual filters can be applied to either columns or measures. For example, Continue reading
